Maritime Economic and Corporate Driving Forces in maritime transport
Maritime trade is considered as a cornerstone of International trade. With the change in the economic policies of the countries and willingness to open boarder for trade resulted in exponential growth in global trade and hence further resulted in growth in shipping trade.
Growth of Seaborne trade and ton-mile:
As the resources and goods are not always produced in a location of demand. This drives the concept of International trade. With the increase in demand in emerging economies like, China, India, Brazil, Indonesia leads to significant rise in International trade.
Maritime trade has grown significantly over the period:
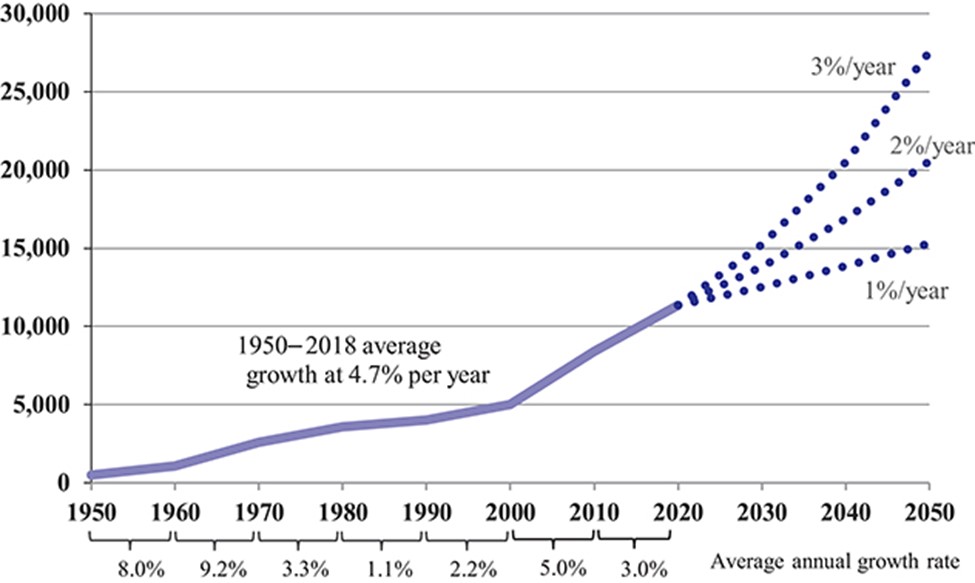
2000—- The total cargo moved was 5984 million tons
2018—– The total cargo moved is 11587 million tons
As most of the growth was driven by crude oil and Iron ore & coal shipments, thus benefiting the shipping industry, contributing the growth in volumes and distances. China’s firm crude oil demand and diversification strategy because of which leads to oil import from Atlantic Basin like Angola, US added to tons-miles growth in Tanker division.
The impact of emerging economies and globalization leads to change in maritime industry from a country based to becoming the global Industry with real boom noted in 2000~2009 (Ma, 2018).
The main reasons for the rise in world trade during 2000 ~ 2018 are the following:
- Increase in shipping productivity, which has made it as cheapest mode of transport and boost shipping trade (Ma, 2018).
- Change in the economy policy of the countries during 2000 ~ 2018
- Formation of No trade barriers
- Arising of demand and needed supply due to significant growth of Emerging economies.
Maritime Economy & Corporate driving forces:
World trade grew at 7% in 20years compared to world economy, which grew at 2~2.5%, the main reason can be accounted for that traded goods are relatively cheaper than the goods not traded.
As world trade & world economy are inter-related and Shipping being cheaper transport, resulted in significant growth of Maritime economy (Ma, 2018).

Considering the average freight cost in 2000 as $12000/day and considering the inflation dollar has undergone within last 18years, $1 in 2000 is equivalent in purchasing power to about $1.46 in 2018, an increase of $0.46 over 18 years. Taking above equivalent, the freight cost in 2018 would be $16194/day. However, average freight rate in 2018 is $11092/day, which is much lower than the equivalent freight cost in 2000. As most of the low value cargo are transported by shipping, the reduced cost of transport has a positive impact on shipping trade and add to its growth.
The low-cost sea transport implication could be seen with commodity trade like coal. Even though countries like India and China have abundant coal reserves that could feed the domestic requirement, however, due to the low-cost production in countries like Australia or Indonesia and continual declining maritime transport cost, countries like India and China found that it is more cost-effective to feed their steel plants and power stations, particularly those located along the coast, with imported coal rather than the domestic products.
Change in economic policies (Shedding of protectionism policy) :
Establishment of WTO in 1995 had a major impact on world trade, impact was realized from year 2000 onward. WTO members have lower trade barriers among each other, including tariff and regulations. According to the WTO, the average import tariff of the developed countries fell from 14% in 1952 to 3.9% in 2005. A similar evolution noted in less-developed countries like India, for example, average tariff rate down from 33% in 2003 to 17.1% in 2018 and China’s 9.8% average tariff rate in 2018 was the result of a massive reduction from about 40% in 1985, such trade friendly policies resulted acceleration in world trade.
Taking the case of China, the change in China’s economic reform in 90’s , which allows privatization of the Industries and shedding of protectionist policies by reducing tariff to 9.8% resulted in accelerated growth. In 2001, China joined the world trade organization (WTO) and private sectors grew remarkably, accounting for as much as 70 percent GDP by 2005 until 2013, unprecedented growth occurred, with the economy increasing by 9.5% a year.
2000s Commodity Super Cycle :
The 2000s commodities super cycle was the rise of commodity prices during early phase of 2000s. The boom was largely due to the rising demand from emerging markets such as the BRIC countries, particularly China during the period from 2000.
With the emerging economies like China and India, the rapid industrial growth directly increase their demand for oil. Even though, both the countries have sufficient oil reserve to feed their domestic need. However, increase in refineries capacity and Industrial demand shift the countries to importers of Oil, specially, China. In 2000, China accounted for 5.8% of global crude oil demand. By 2015, that figure exceeded 12%–roughly one in every eight barrels used worldwide. Unlike, European countries, both China and India depends on maritime transport for Oil import.
International Iron ore trade is the second-largest single seaborne trade commodity after crude oil. After 2002 the commodity was in strong demand by the emerging economies, particularly China due to expansion of steel Industry due to domestic requirement. The average growth rate between 2002 and 2014 was 6.1%.
The iron ore demand until 2000 was stable. However, with China accelerated import to suffice Ship building requirement boost the Iron ore trade since 2000 to 2017. The demand from China is so significant that in 2014 about 68% of the global export of iron ore went to China, establishing a new trend in world economy. Brazil and Australia being the major exporter of Iron ore dominated the market and with reduce transport cost maritime trade grew significantly. (Ma, 2018)
Manufactured products and Maritime trade:
Today virtually all manufactured goods that can be loaded into containers have been moved by container ships. Consequently, the global container trade increased from 67 million TEU in 2000 to 187 million TEU in 2018, with an annual growth rate of over 8%.
Due to availability of technology and cheap but skilled labor, the manufacturing centers moved from more advanced countries to less advance countries like China, and Vietnam and Indonesia. As most of the manufactured goods are transported using container, with the growth of China in 2000s as manufacturing hub, seaborne trade significantly.
Regional Trade agreement:
The formation of regional trade agreement is one of the driving forces that resulted in exponential growth in shipping (Ma, 2018).
As the ASEAN member countries are the major contributor to the world trade. Due to the geographic location of the ASEAN member states like Japan, South Korea are island countries, as such most of the trade is by maritime transport. With growth of emerging economies like China, South Korea, Indonesia and India since 2000, resulted in significant growth in Maritime trade.
Future possible development in Shipping:
After a long period of fast development, a slowdown is inevitable. Apart from the global population and economic catching-up-related uncertainties, the future maritime demand will be heavily affected by new environmental standards, particularly those for fossil fuels. In 2018 about 30% of world seaborne trade was of oil and coal. So a reduction of trade in fossil fuels will undoubtedly have a big impact on future maritime demand. (Ma, 2018)
Apart from decelerated globalization process and rise of protectionism, US & China trade war, the ever-increasing environmental pressure would have detrimental effect on maritime trade. With uncertainties pertaining to EEXI particularly with the confirmation of annual reduction factor by CII, speculation are mounting on demand for more tonnage that would suffice slow vessel movement.
Taking a conservative approach and 11bn tons of cargo in 2018 as base , the future maritime trade in 2050 is about 20 Bn tons. (Ma,2018)
Reference
Ma, S. (2018). Economics of maritime business. Routledge, Taylor & Francis Group.
